Key Takeaways
- Integrating large language models with Power BI enables intelligent health analytics through semantic filtering, similarity search, and predictive modeling.
- The solution processes diverse inputs—from clinical reports to social media chatter—using NLP, embedding generation, and LLM-based analysis to deliver real-time, contextual insights.
- Power BI provides dynamic visual tools like heatmaps, geospatial maps, and time-series charts, helping users identify trends, detect anomalies, and act swiftly.
- The integration delivers high-impact use cases for communities and governments, from tracking disease outbreaks to mental health monitoring and vaccination sentiment analysis.
- The pipeline supports federated learning for privacy compliance, automated alerts for risk detection, and intelligent filtering for efficient public health responses.
Integrating large language models (LLMs) with Power BI transforms community health trend analysis by enabling AI-driven filtering, similarity or semantic search, and predictive analytics. The user can apply filters in Power BI, which are employed as keywords to initiate intelligent searches on a vectorized database of health data. This extracts meaningful insights from unstructured data to support real-time decision-making, anomaly detection, and public health interventions.
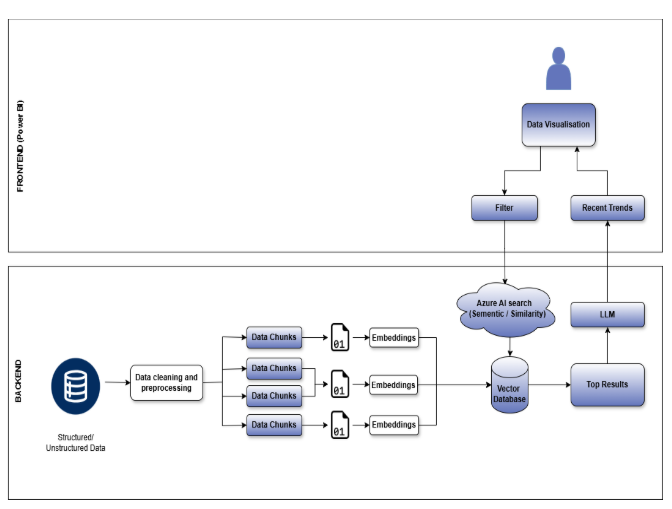
AI-Driven Pipeline for Community Health Insights
This flow chart illustrates the combination of LLM and Power BI for community health analytics, including data ingestion, vector embedding, semantic search, and AI-powered visualization.
Structured Pipeline for Integration
To integrate the LLM-based health trend analysis pipeline easily, follow the subsequent key constituents that describe the entire process:
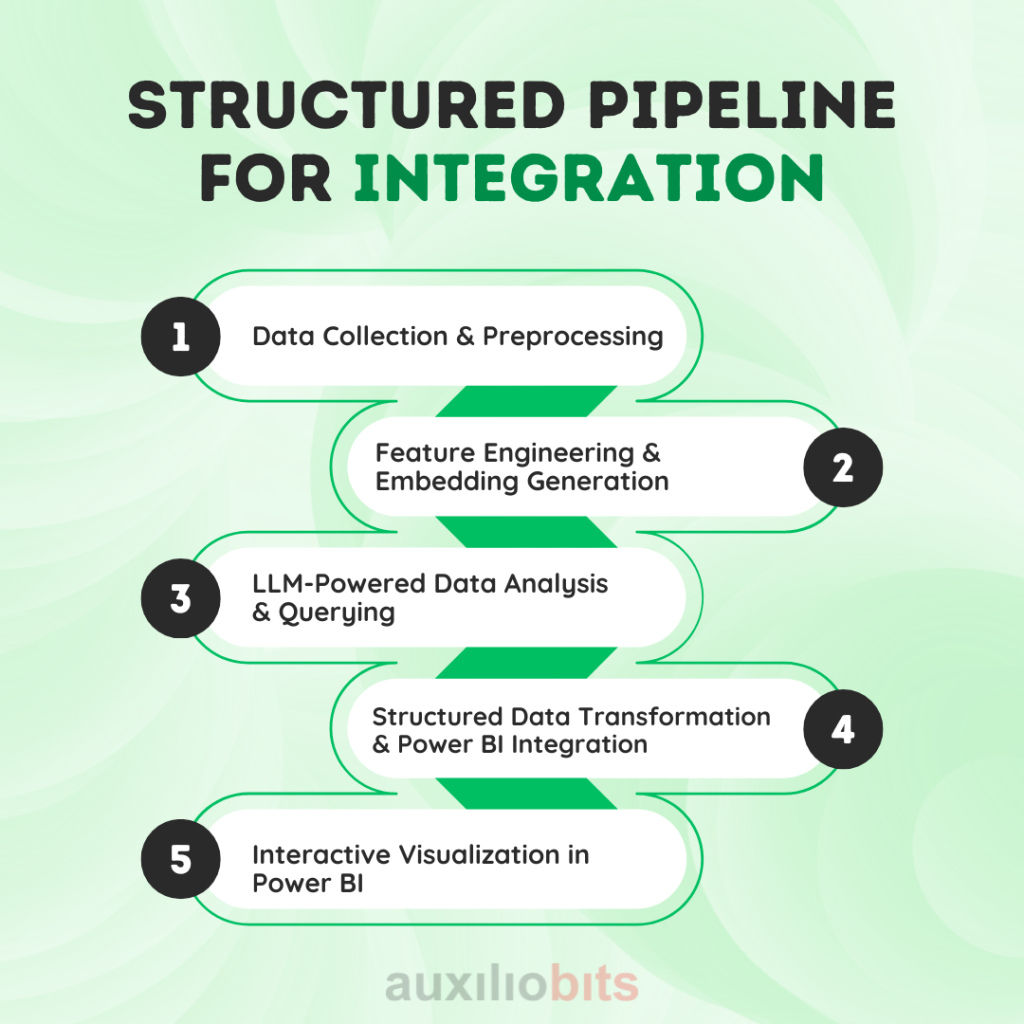
1. Data Collection & Preprocessing
- Gathers structured & unstructured health data from various sources (patient reviews, social media discussions, clinical reports, surveys).
- Gathers structured & unstructured health data from various sources (patient reviews, social media discussions, clinical reports, surveys).
2. Feature Engineering & Embedding Generation
- Extract key entities such as symptoms, disease names, sentiment indicators, and risk factors.
- Convert the text into vector embeddings for semantic or similarity-based querying.
- Store these embeddings in a vector database for fast lookup and retrieval.
3. LLM-Powered Data Analysis & Querying
- User Input in Power BI:
- Users apply some filters in Power BI (e.g., location, disease, age group, demography).
- These filters are captured and converted to query keywords for searching.
- Azure AI Search Using Vector Database:
- Find matching health trends, reports, and symptoms.
- Retrieves top relevant embeddings for deeper analysis.
- LLM-Driven Contextualization:
- Extracts various trends from the retrieved results.
- Performs sentiment analysis on these community health discussions.
- Predicts various disease outbreaks based on historical patterns.
4. Structured Data Transformation & Power BI Integration
- Converts the LLM-derived insights into structured formats (CSV, SQL, JSON).
- Import this transformed data into Power BI through different mechanisms such as APIs, SQL connectors, or direct query pipelines.
- Allow real-time updates to show the changing trends dynamically.
5. Interactive Visualization in Power BI
User Queries & Filtering: Power BI users interactively apply filters, triggering the AI-powered semantic and similarity searches in the backend to generate the results
AI-Driven Visualizations Provided by PowerBI
- Drill-Down Insights: The users can also narrow down the filters to get deeper correlations among different health parameters.
- Heatmaps: It provides sentiment distribution for public opinion analysis.
- Geospatial Maps: These can project disease prevalence for different regions.
- Time-Series Charts: They track symptoms and disease trends over time, split by age groups to spot trends for different populations.
Use Cases and Benefits
This integration of PowerBI with LLM benefits many ways, including ensuring disease detection, automated alerts, and other real-world applications. Some of the use cases and benefits are listed below.
Real-World Applications
- Tracking Disease Outbreaks: Analyze social media posts to identify flu or COVID-19 hotspots.
Mental Health Monitoring: Use sentiment analysis to detect rising mental health concerns. - Vaccination Campaigns: Monitor public sentiment and identify areas with vaccine hesitancy.
Key Benefits
- Smart Filtering in Power BI: It allows dynamic exploration of health trends.
- Early Disease Detection: It also identifies rising symptoms & outbreak patterns.
- Resource Allocation Insights: Helps prioritize critical regions for intervention.
- Automated Alerts: Triggers notifications when health risks exceed thresholds.
- Federated Learning for Privacy: Ensures compliance (HIPAA/GDPR) while analyzing distributed data securely.
Conclusion
Combining Power BI and LLMs for community health analysis provides a powerful, data-driven platform for tracking and forecasting health trends. AI-driven visualizations in Power BI take this analysis even further, allowing health professionals to identify emerging threats, assign resources effectively, and provide proactive public health responses. This automated and scalable solution allows businesses to make informed, data-driven decisions that enhance positive community health outcomes.